Swans » Dossiers
United States' Gargantuan Energy Appetite
by Gilles d'Aymery
In 1999, the world energy consumption was 382 quadrillion (Quads) British thermal units (Btu). (1) Out of 382 Quads the USA consumed 97, or 25.39 percent of the worldwide consumption.
The USA, with a population of about 281 million inhabitants -- just about four percent of the world population -- consumes 25 percent of all the world energy and accounts for about 25 percent of the pollution of the earth's ecosystem. (2)
In other words, the USA has a gargantuan energy appetite. This is well known though not particularly brought to the attention of the public.
Let's illustrate the extent of this appetite with the help of an energy flow chart, the U.S. Energy Flow Trends for the year 2000 during which the USA consumed 98.5 Quads. (3) This chart was created by Gina V. Kaiper, Technical Writer-Editor, Energy and Environment Directorate, for the University of California, Lawrence Livermore National Laboratory (LLNL), under the auspices of the U.S. Department of Energy, and is reproduced here by permission.
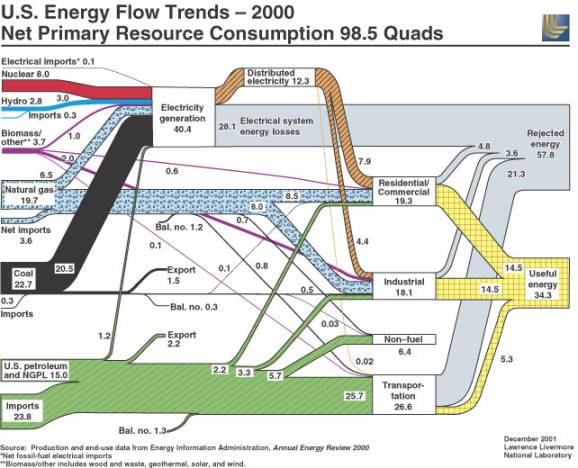
Not surprisingly fossil fuels are the overwhelming source of the energy consumption, 85 percent over all (even more if one adds the wood element of biomass). Petroleum is the biggest component with 38.5 percent, followed by natural gas (23.7%), and coal (22.8%). The net petroleum import in 2000 was 57%. This again is relatively well known.
However, the most startling information provided by this flow chart is the extent of waste in the U.S. energy system; what Ms. Kaiper delicately labels Rejected energy.
Take the time to review this chart carefully. Indeed, please do.
Look at the electricity generation of 40.4 Quads and check out the amount of the electrical system energy losses of 28.1 Quads. What the chart shows is that 69.55 percent of all generated electricity is wasted. (4) So, every time one switches on the 100-watt light in the kitchen or in the bathroom, the system needs to generate some 170 watts to light it... Think about your computer or your air conditioning... (5)
Even worse, 80.07 percent of all energy used for transportation is wasted. What it means is that to get our favorite vehicle, SUV included, all the way to the store, 80 percent of a barrel of oil is required and wasted to bring 20 percent to the power train that make the wheels turn. (6)
The more energy we use the bigger the generation of waste.
For example, in 1999, the USA consumed 97 Quads and the ratios of waste for electricity and transportation were 68 and 79.92 percent respectively. In 1997, 94 quads of consumption brought a respective percentage of waste of 67.38 and 79.92 (note that the transportation waste is pretty constant due to the engineering limitations of the combustion engine -- though the bigger the engine...)
Simply put, the more we consume the more we waste. The more we consume the more we need energy resources. The more we waste and depend on non-renewable sources of energy, namely fossil fuels, the more we must find, develop, grab sources, especially in a time of dwindling resources.
Meantime, we want -- at least in rhetoric -- the entire world to adopt the American way. To put a perspective on this American way, take China as an example: were China to consume the same amount of energy per capita as the United States, the Chinese Net Primary Resource Consumption in 2000 would have been 450.8 Quads! (7) Should the polluting consequences be mentioned?
According to the International Energy Outlook 2002, world energy consumption is projected to increase by 60 percent over a 21-year forecast horizon, from 382 Quads in 1999 to 612 Quads in 2020. Renewable energy use, presently about 9 percent of total worldwide energy consumption, is projected to actually decrease to 8 percent by 2020. (8)
While it simply does not compute it certainly does illuminate the ongoing U.S. policies.
· · · · · ·
References and Notes
1. A quad is 1015 and a Btu is the quantity of heat needed to raise the temperature of one pound of water by 1° F. at or near 39.2° F. (back)
2. "The United States, with the world's largest economy, is also the world's largest single source of anthropogenic (human-caused) greenhouse gas emissions. Quantitatively, the most important anthropogenic greenhouse gas emission is carbon dioxide, which is released into the atmosphere when fossil fuels (i.e., oil, coal, natural gas) are burned. Current projections indicate that U.S. emissions of carbon (mainly in the form of carbon dioxide) will reach 1,694 million metric tons in 2005, an increase of 357 million metric tons from the 1,337 million metric tons emitted in 1990, and around one-fourth of total world energy-related carbon emissions." Source: EIA-DOE; United States Country Analysis Brief; http://www.eia.doe.gov/emeu/cabs/usa.html (back)
3. Permission to reproduce a slightly smaller version of this flow chart was kindly granted by Ms. Deborah Brown-Harris, Authorized Reprint, Copyright & Permissions Agent, Lawrence Livermore National Laboratory, Technical Information Department. Credit is given to the University of California, Lawrence Livermore National Laboratory, and the Department of Energy under whose auspices the work was performed. We acknowledge the U.S. Government's right to retain non-exclusive, royalty-free license in and to any copyright covering this material. Energy flow charts for the United States can be accessed on the Web site of LLNL at http://en-env.llnl.gov/flow/. The full size energy flow chart for 2000 can be viewed at http://en-env.llnl.gov/flow/00flow.html.
In addition, Gina Kaiper recommended that we include a link to the Energy Flow web page "to provide access to the accompanying report that documents and explains the data sources and the terms and categories. For example, as the report explains, the proportion of 'useful' to 'rejected' shown on our chart derives from the conversion efficiencies (page 5 of our report) of the technologies involved." This is a must-read report for anyone wanting to fully understand the flow chart. The report, in Adobe Acrobat format (pdf file, size: 177 kb) can be accessed at http://en-env.llnl.gov/flow/pdf/USEnFlow00-quads.pdf.
Finally, the permission granted by LLNL should not be construed as an endorsement of this Swans dossier. (back)
4. My thanks go to Richard Merk and Steve Mader for leading me in the right direction. I also wish to express my gratitude to Ian Woofenden and the folks at Home Power Magazine for their invaluable help. Home Power, "The Hands-On Journal of Home-Made Power," is based in Ashland, Oregon, and focuses on alternative and renewable energies. The magazine published an article by Randy Udall, "U.S. Energy Flow: In the Belly of the Beast," in its February/March 2002 issue. It can be read online in Adobe Acrobat format (pdf) at http://www.homepower.com/files/bonus.pdf (back)
5. "According to AER2000 (p. 248, Note 1), 'Electrical system energy losses are estimated as the difference between total energy consumed to generate electricity and the total energy content of electricity consumed by end users. Most of these losses occur at steam-electric power plants (conventional and nuclear) in the conversion of heat energy into mechanical energy to turn electric generators' . . . . Transmission and distribution losses....are estimated to be about 9% of the gross generation of electricity." Source: Gina V. Kaiper, U.S. Energy Flow—2000, February 2002, University of California, Lawrence Livermore National Laboratory, http://en-env.llnl.gov/flow/pdf/USEnFlow00-quads.pdf; page 5. (back)
6. "For transportation, we continue to assume a generous 20% efficiency, which corresponds to the approximate average efficiency of internal combustion engines as measured on Federal Driving Schedules (i.e., the amount of energy that actually reaches the drive train of a vehicle, compared to the amount of energy consumed. Note that the peak efficiencies of 33-35% for spark-ignited engines and 41-45% for diesel engines are not representative of conversion efficiencies over the Federal Driving Schedules.)" Source: Gina V. Kaiper, U.S. Energy Flow—2000, February 2002, University of California, Lawrence Livermore National Laboratory, http://en-env.llnl.gov/flow/pdf/USEnFlow00-quads.pdf; page 5. (back)
7. According to the CIA - World Factbook 2002, the US population is 280,562,489 (July 2002 est.) and the Chinese population 1,284,303,705 (July 2002 est.). While I am using 2002 population figures and applying them to energy consumption in 2000, the result is slightly inexact but one can easily get the gist of the correlation. In 2000 the Chinese consumption of electricity was 1.206 trillion kWh; that of the United States, 3.613 trillion kWh. Source: CIA - The World Factbook 2002; http://www.cia.gov/cia/publications/factbook/index.html. (back)
8. Source: EIA-DOE; International Energy Outlook 2002 - Highlights; http://www.eia.doe.gov/oiaf/ieo/index.html. (back)
Fossil Fuels and Energy Ressources
· · · · · ·
Dossier compiled by Gilles d'Aymery, Swans' publisher and co-editor.
Do you wish to share your opinion? We invite your comments. E-mail the Editor. Please include your full name, address and phone number. If we publish your opinion we will only include your name, city, state, and country.
Please, feel free to send this dossier to your representatives in the US Congress, or to insert a link to this dossier on your Web site or to disseminate its URL on your favorite lists, quoting the first paragraph or providing a summary. However, please DO NOT steal, scavenge or repost this work on the Web without the expressed written authorization of Swans. This material is copyrighted. All rights reserved. No part of this material may be reproduced, stored in a retrieval system or transmitted in any form or by any means, electronic, mechanical, photocopying, recording or otherwise, without the prior written permission of the publisher. Also, please note that if you are interested in the flow chart you must contact the Lawrence Livermore National Laboratory.
Published October 21, 2002
[Copyright]-[Archives]-[Resources]-[Main Page]
Swans
http://www.swans.com/